
You Don't Need to Pick the Winners But You Do Need To Own Them
If you could travel back to 1926 with a list of the best-performing shares of the next 100 years, investing would be remarkably easy. Unfortunately, the list is only available now.
Professor Hendrik Bessembinder of Arizona State University has updated his landmark research into individual stock returns, examining almost 30,000 US-listed stocks over the 100 years from 1926 to 2025 (the entire dataset available).
The results are a useful reminder of something investors often underestimate: stockmarkets have been extraordinary creators of wealth, but most individual stocks have not.
In fact, the wealth has come from a surprisingly small group of companies.
The average stock is not the stockmarket
Over the past 100 years, the US stockmarket returned approximately 10.1% per annum, compared to 3.3% per annum from one-month US Treasury Bills (the lowest risk asset in the world).
That is an extraordinary long-term reward for owning equities, where $1 grew to become $15,091. In contrast, $1 invested in US Treasury bonds grew to $25.71 – a 587 times difference.
But underneath that market return sits a cautionary story.
Across the almost 30,000 individual stocks:
the median lifetime return[i] was -6.9%;
only 48.2% produced a positive lifetime return;
only 41.2% beat Treasury Bills over the same period; and
only 27.6% outperformed the broader stockmarket.
So, despite the stockmarket creating enormous wealth, the typical individual stock was not a particularly good investment.
How can both things be true? Because investment returns are not evenly distributed.
A very small number of companies do most of the heavy lifting
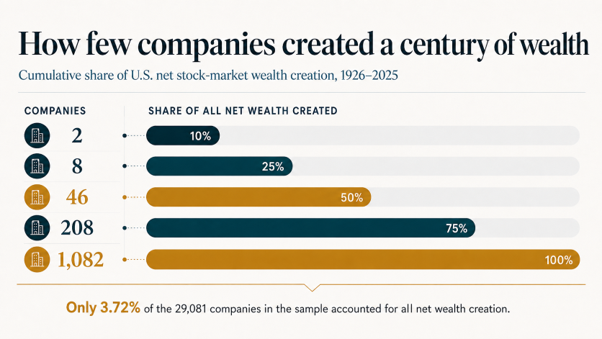
Bessembinder estimates just 1,082 companies (3.7% of the firms in the study) accounted for all net wealth creation, meaning the wealth created in excess of the return of Treasury Bills.
This doesn’t mean the other 96.3% all lost money. Many produced positive returns. Rather, when their gains and losses are added together, they collectively created no net wealth above Treasury Bills.
More strikingly, only 46 companies accounted for half of it.
A handful of very big winners can therefore overwhelm the mediocre or terrible results from thousands of other companies.
There is a simple logic behind it. The most you can lose by owning a share is 100%. But there is no equivalent ceiling on the upside. A successful company can increase tenfold, one hundredfold or considerably more, particularly when strong returns compound over several decades.
The losers eventually disappear. The winners can keep compounding.
This isn't just an American story
It would be tempting to look at today's enormous US technology companies and conclude that this concentration of wealth creation is mainly a feature of the American market. Bessembinder's global research suggests otherwise.
The research examined 63,785 companies across 43 global markets between 1990 and 2020.
The results were remarkably similar.
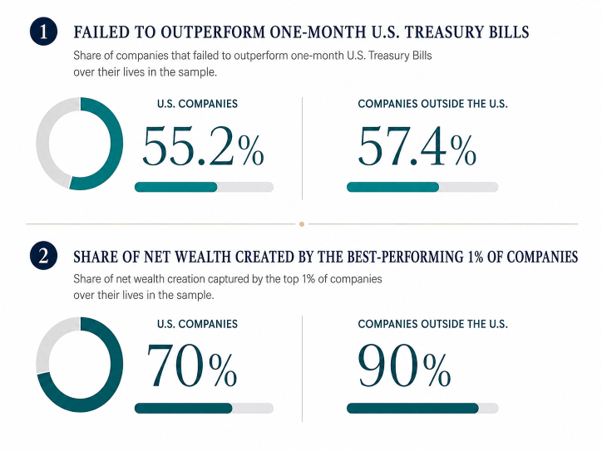
55.2% of US companies and 57.4% of companies outside the US failed to outperform one-month US Treasury Bills over their lives in the sample.
Just 1,526 companies, or 2.4% of the entire sample, accounted for all of the net shareholder wealth creation.
In fact, outside the US the concentration was even greater
The best-performing 1% of US companies accounted for around 70% of US net wealth creation. Outside the US, the best-performing 1% accounted for approximately 90%.
The winners can come from almost anywhere
The names behind the global numbers are also interesting.
Of the 50 companies that created the most shareholder wealth globally between 1990 and 2020, 35 were American and 15 were from outside the US.
Those non-US companies included Tencent, Samsung Electronics, Taiwan Semiconductor Manufacturing, Nestlé, Roche, Toyota, LVMH, L'Oréal, ASML, Alibaba and Saudi Aramco.
And one company can have an extraordinary impact on an entire country's investment experience.
According to the research:
Samsung Electronics accounted for around 33.5% of South Korea's gross wealth creation;
Taiwan Semiconductor accounted for 36.6% in Taiwan;
Novo Nordisk accounted for 26.5% in Denmark;
Nestlé accounted for 21.4% in Switzerland; and
Saudi Aramco accounted for 33.4% in Saudi Arabia.
Australia was hardly immune. The research found that the best-performing 1% of Australian companies accounted for more than 60% of the gross shareholder wealth created by Australian companies over the period studied.
From 1990 to 2020 the largest Australian wealth creators were BHP, Commonwealth Bank and CSL. Note if the research extended beyond 2020 CSL would be removed from the top 3, as the share price is down -55% over the past 5 years. The lesson is that even yesterday’s exceptional wealth creators are not guaranteed to remain tomorrow’s winners.
Five companies. More than 10% of global wealth creation.
Across almost 64,000 companies globally, the five largest wealth creators between 1990 and 2020 were: Apple, Microsoft, Amazon, Alphabet and Tencent. (I had to look up Tencent as well – it is a Chinese technology company that owns WeChat and Epic Games).
Those five companies represented just 0.008% of all companies in the study yet together accounted for 10.34% of all net global stockmarket wealth creation.
The lesson is not that investors should have bought Apple. It is that they needed to own Apple before everyone knew it was Apple. The company was founded in 1976, but by the mid-1990s Apple was in genuine strategic and financial trouble. Combined losses in 1996 and 1997 were US$1.9 billion. In early 1997 the Wall Street Journal ran the headline “Drop in Performa Sales Hurts Apple Computer’s Turnaround” after sales fell 10% in the crucial December quarter and 4,100 job cuts were announced. Who was picking Apple to be the next big thing at this time?
Looking backwards is considerably easier than investing forwards
Today, companies such as Apple, Nvidia and Microsoft can look like obvious investments. They weren't always.
The uncomfortable message from Bessembinder's research is not that investors should own today's biggest winners. Look at the CSL experience.
It is that identifying tomorrow's biggest winners in advance is extremely difficult.
Consider the global list.
Tencent entered Bessembinder's dataset in 2004 and still became one of the five greatest wealth creators in the world by 2020. Amazon only entered the dataset in 1997. Alphabet arrived in 2004. Among the top 50 global wealth creators were companies from technology, consumer goods, luxury goods, pharmaceuticals, banking, semiconductors, automobiles and energy.
The companies change. What persists is our inability to know beforehand which relatively small number will generate a disproportionate amount of future wealth.
The list only becomes obvious after the wealth has been created.
Diversification isn't about avoiding losers
This is where diversification is sometimes misunderstood. The objective isn't to construct a portfolio in which every investment succeeds. That is impossible.
A diversified portfolio will inevitably own disappointing companies. It will own businesses that struggle, businesses that disappear and plenty that deliver ordinary returns.
The reason to diversify is to increase the probability that you also own the relatively small number of companies that generate exceptional returns.
Missing one insignificant company doesn't matter.
Missing the next Apple, Taiwan Semiconductor or Tencent might.
This is also why we are wary of portfolios built around a small number of supposedly "high conviction" ideas. Every concentrated portfolio contains an implicit forecast about which companies can safely be excluded.
Bessembinder's research suggests that is a rather large assumption.
Diversification doesn't mean abandoning investment discipline
Bessembinder's research is not an argument for simply buying today's largest companies. Those companies appear on his list because we now know they were the winners. The harder question is which companies will dominate the next 30 years.
At Lorica Partners, we prefer not to make that prediction. Instead, we diversify broadly enough to capture tomorrow's exceptional companies while systematically placing greater weight on characteristics such as relative price, size and profitability that the evidence suggests are associated with higher expected returns.
The distinction is important.
Bessembinder tells us why we should own broadly. Lorica’s approach, built on the foundation of Nobel-prize winning research, helps us decide how much of each company to own.
We can make evidence-based decisions about how much exposure we want to different types of companies without making our financial future dependent on correctly identifying a handful of individual winners.
You don't need to find the next Nvidia
There will almost certainly be extraordinary companies created over the decades ahead. Some may already exist. Others may operate in industries that barely exist today. And, importantly, there is no reason to assume they will all be American.
We don't know their names. Neither does anyone else.
You don't need to know which 46 companies will create half of the next generation of stockmarket wealth. You just need a portfolio with a very good chance of owning them.
Author: Rick Walker
Source:
[i] Hendrik Bessembinder, Do Stocks Outperform Treasury Bills?, Journal of Financial Economics, 2018.
[ii] Hendrik Bessembinder, Te-Feng Chen, Goeun Choi and K.C. John Wei, Long-Term Shareholder Returns: Evidence from 64,000 Global Stocks, Financial Analysts Journal, 2023.
[iii] Hendrik Bessembinder, One Hundred Years in the U.S. Stock Markets, 2026 working paper.
[i] In this article, “lifetime return” means the total cumulative return an individual stock delivered from the date it first entered the market until it was delisted or otherwise ceased to be listed. It is not an annualised return.