Staying Positive during Market Volatility
For investors who started their investment journey in early 2020, their experience over the past three years has been tumultuous to say the least. A global pandemic was followed by a period of unexpectedly high inflation.
As of April 2023, the last new all-time high for the US stockmarket (the world’s largest) was 3 January 2022 – or over 480 days ago. [US data is the best data to look at given it goes back to 1926 – for Australia we have reliable market data back to around 1975]. For some, that feels like a long time.
But based on the history of bear (or downwards trending) markets, it is not overly long. History tells us it can take time for new market highs to be reached. The table below looks at every bear market since 1950, and the number of days to go from peak to trough and from the prior peak to a new high:

On average, the peak-to-trough fall is -35% over a 381-day period, or just over a year.
The average number of days to go from the previous peak to a new all-time high is 1,166 days, or more than 3 years.
So it can take some time to recover from a bear market[i]. If you follow your portfolio returns closely, it is not unusual for the stockmarket to make you feel terrible on a regular basis. However, the stockmarket can be a fun place over short periods.
The graph below shows rolling one year returns for the U.S S&P 500 index back to 1926:
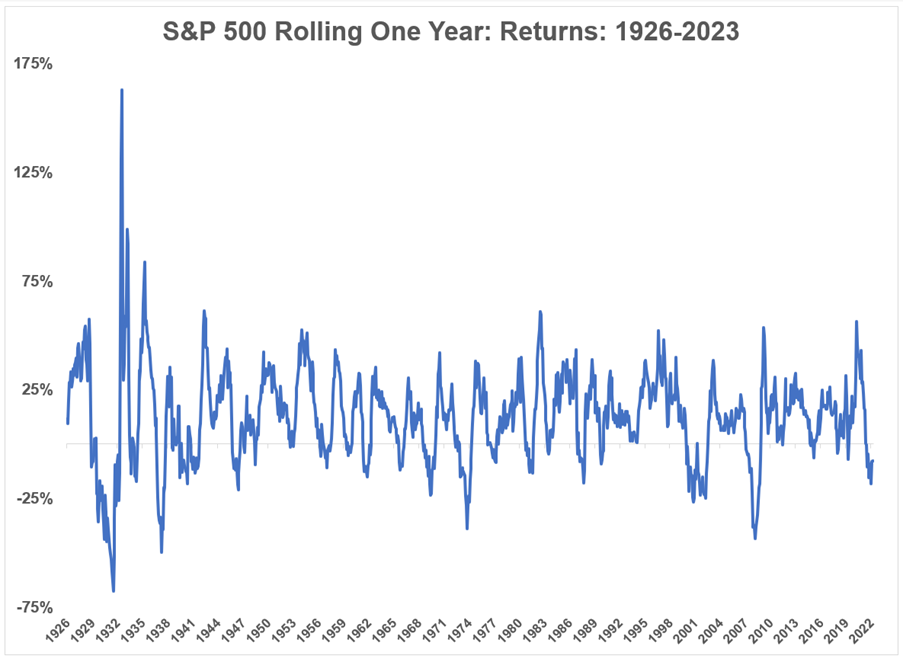
Plenty of bad times to be sure but the stock market has been up in 75% of all rolling one year returns[ii]. In other words, the market has been down 1 out of every 4 years (on average).
Those are attractive odds. The bad times are painful but the good times more than make up for it. The US stockmarket has an average annual return of 10% since 1926.
To emphasise this point, it can be helpful to go beyond just positive or negative returns and look at different magnitudes of performance over these one-year periods.
For instance, the S&P 500 has been down 10% or worse in 12.9% of all rolling one-year periods. But the market has been up by 10% or more 57.1% of the time.
The gains outweigh the losses at other magnitudes as well:

The stock market is down 20% or worse 6% of the time but up 20% or more almost 34% of the time over rolling one-year periods.
Forty percent moves over a one year time frame are rare but even then the gains outweigh the losses by a factor of almost 7-to-1.
The latest 12 month return through the end of March is a loss of around 8%. Losses of 8% or worse have only occurred in 15% of historical one-year returns.
Most of the time things are better than the current market environment but that is the risk of investing in stocks – uncertainty is what drives returns. You do not get good times without bad times.
What is the historical win rate? This graph shows the probability of having a positive stockmarket return over various time horizons:

As you might expect, the longer your time horizon, the better your chances of seeing positive returns.
On a daily basis, the historical win rate is only around 55%, meaning 45% of all trading days have been losses. The more often you look at your investments in the stock market, the worse it is going to make you feel since we spend so much time in a state of drawdown.
Richard Thaler’s behavioural finance term for this phenomenon is myopic loss aversion.
Loss aversion is the idea that losses sting twice as bad as gains make us feel good. And myopia is the idea that the more frequently you look at your portfolio, the more likely you are to experience the sting from loss aversion.
Plus, it’s not like paying more attention to your portfolio will guarantee better results. For most investors, paying more attention can lead to more mistakes because that myopic loss aversion tempts you into making more changes to your portfolio, which can lead to more mistakes from your emotions.
It’s not easy to ignore your investments or the stock market in this day and age. Information is everywhere.
But the less you look the better you will feel about your performance.
Author: Rick Walker – this article is primarily a combination of two articles written by Ben Carlson:
The Good & Bad of Investing in the Stock Market - A Wealth of Common Sense
Why the Stock Market Makes You Feel Bad All the Time - A Wealth of Common Sense
Thank you, Ben.
[i] This is price-only index data so no dividends are included. If we looked on a total return basis that would shorten the gap a little bit.
[ii] The best 12-month rolling return of 162% for the month ending in June 1933 followed the worst 12-month rolling return of -68% in the month ending June of 1932. A depression can have that effect on markets.