Why many wealthy people aren't happy

We’ve all heard that money doesn’t buy happiness. But some recent research has helped to explain why this is the case.
Joe Pinsker recently wrote an article about why many wealthy people aren’t satisfied with their wealth. Some of the key takeaways were:·
Michael Norton, a Harvard Business School professor who has studied the connections between happiness and wealth, says that research regularly points to two central questions that people ask themselves when determining whether they’re satisfied with something in their life: Am I doing better than I was before? and Am I doing better than other people? This applies to wealth, but also to attractiveness, height, and other things that people fret about.
“But the problem is,” Norton says, “a lot of the things that really matter in life are hard to measure. So if you wanted to be a good parent, it’s a little hard to know if you’re being a better parent now than you were a year ago, and it’s also hard to know if you’re a better parent than the neighbours.”
So people turn to dimensions of comparison that can be quantified. “Money is a terrific one,” Norton says. “If I need to know if I’m doing better than I was, the easy thing to ask is, Am I making more money? or Does my house have more square feet? or Do I have more houses than I used to?”
This instinct to measure and compare doesn’t disappear once people have an obscene amount of money. “The problem is, Am I doing better than I was? is only [moving people in] one direction, which is up,” Norton says. And if a family amasses, say, $50 million but upgrades to a neighbourhood where everyone has that much money (or more), they feel a lot less rich than if they had stuck to the peer comparisons they were making tens of millions of dollars ago. Hence the ever-shifting goalposts of wealth and satisfaction.
The research Norton has conducted illustrating this phenomenon can be dispiriting. In a paper published earlier this year, he and his collaborators asked more than 2,000 people who have a net worth of at least US$1 million (including many whose wealth far exceeded that threshold) how happy they were on a scale of one to 10, and then how much more money they would need to get to 10. “All the way up the income-wealth spectrum,” Norton told me, “basically everyone says [they’d need] two or three times as much” to be perfectly happy.
Brooke Harrington, a professor at the Copenhagen Business School who has studied and written about the financial practices of the super-wealthy, says that the question many rich people ask themselves about their money is not Do I have enough to buy this expensive thing I want? but rather Do I have as much or more than these people I’m comparing myself with?
This information is not designed to make you feel depressed – we promise - but rather is a reminder that these behaviours can not only impact on our happiness, but also negatively influence our decision making regarding investments.
It is very easy to compare our own investment returns to the ‘Five best stock performers’ last year or some article in the paper about a fund manager (who you’ve previously never heard of) who outperformed their peers in recent times.
But we must remember that no investment approach exists that provides the best returns each and every year. And even those who do perform well over short periods rarely continue this performance into the future.
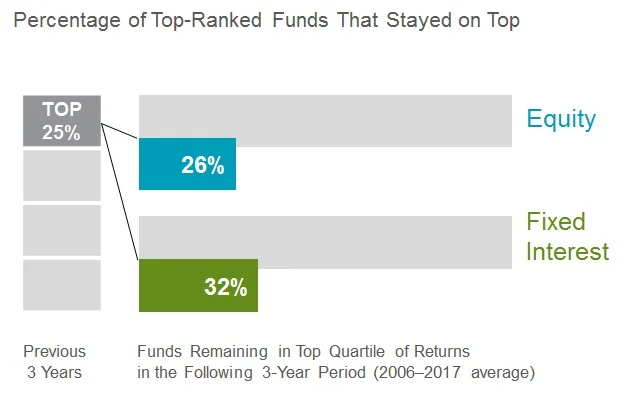
Some investors select managed funds based on their past returns. Yet, past performance offers little insight into a fund’s future returns. For example, most U.S funds in the top quartile (25%) of previous three-year returns did not maintain a top‐quartile ranking in the following three years, as this graph shows[i]:
Our goal at Stewart Partners is for each client to understand what investment returns they need to achieve their goals. We then track performance over time against their plan and make adjustments as necessary. And we think the evidence based investment approach we adopt for clients provides the highest probability of consistently delivering the returns they need to achieve what is most important to them.
If your focus remains on what you need to achieve the best life you can imagine, and you ignore the noise and short-term comparisons, you can not only improve your long-term investment outcomes, but also your overall happiness along the way.
Author Rick Walker
[i] The funds referred to are US mutual funds which are not registered as managed investment schemes with the Australian Securities and Investments Commission and as such these funds are not currently available to New Zealand and Australian investors. This study evaluated fund performance persistence over rolling periods from 2001 through 2017. Each year, funds are sorted within their category based on their previous three-year total return. Those ranked in the top quartile (25%) of returns are evaluated over the following three-year period. The chart shows the average percentage of top-ranked equity and fixed interest funds that kept their top ranking in the subsequent period. US-domiciled open-end mutual fund data is from Morningstar and Center for Research in Security Prices (CRSP) from the University of Chicago. Index funds and fund-of-funds are excluded from the sample. Equity fund sample includes the Morningstar historical categories: Diversified Emerging Markets, Europe Stock, Foreign Large Blend, Foreign Large Growth, Foreign Large Value, Foreign Small/Mid Blend, Foreign Small/Mid Growth, Foreign Small/Mid Value, Japan Stock, Large Blend, Large Growth, Large Value, Mid-Cap Blend, Mid-Cap Growth, Mid-Cap Value, Miscellaneous Region, Pacific/Asia ex-Japan Stock, Small Blend, Small Growth, Small Value, and World Stock. Fixed interest fund sample includes the Morningstar historical categories: Corporate Bond, High Yield Bond, Inflation-Protected Bond, Intermediate Government, Intermediate-Term Bond, Muni California Intermediate, Muni California Long, Muni Massachusetts, Muni Minnesota, Muni National Intermediate, Muni National Long, Muni National Short, Muni New Jersey, Muni New York Intermediate, Muni New York Long, Muni Ohio, Muni Pennsylvania, Muni Single State Intermediate, Muni Single State Long, Muni Single State Short, Short Government, Short-Term Bond, Ultrashort Bond, and World Bond. See Dimensional’s “US Mutual Fund Landscape 2018” for more detail. Index data provided by Bloomberg Barclays, MSCI, Russell, FTSE Fixed Interest LLC, and S&P. Bloomberg Barclays data provided by Bloomberg. MSCI data © MSCI 2018, all rights reserved. Frank Russell Company is the source and owner of the trademarks, service marks, and copyrights related to the Russell Indexes. FTSE fixed interest indices © 2018 FTSE Fixed Interest LLC. All rights reserved. S&P data © 2018 S&P Dow Jones Indices LLC, a division of S&P Global. All rights reserved. Indices are not available for direct investment. Their performance does not reflect the expenses associated with management of an actual portfolio. There is no guarantee investment strategies will be successful. Past performance is no guarantee of future results.